An interesting guide for Gnuplot
I accidentally stumbled upon an interesting guide to creating graphs using Gnuplot, program which I have already spoken months ago.
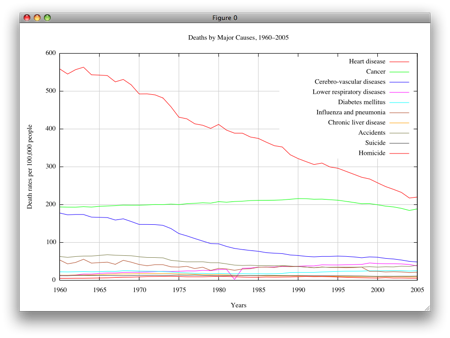
Shown are several examples, both in 2D and in 3D, with the addition of the legend to improve the readability of the graphs.
Also shows how to import data statistical experimental (is. text file with a list of values in discrete form).
The guide, although written in English, is the work of an Italian who lives in Canada and works for IBM (strange, there are few Italians who in recent years are emigrating, eh?), and is within this address.
Take this opportunity to remember that, in my usual osx/linux repository, can download binary packages for Ubuntu and OSX versions of the latest CVS of gnuplot.

